Job Tracing
Jobly automatically tracks the flow of jobs across handlers. When a job handler spawns new jobs, they share a TraceId, making the full execution chain visible in the dashboard.
How It Works
Every job gets two trace fields:
- TraceId — All related jobs share this ID. The first job in a flow creates it (
TraceId = own ID). All spawned jobs inherit it. - SpawnedByJobId — Direct "who created me" link.
This happens automatically via AsyncLocal context. When a handler calls publisher.Enqueue() or batchPublisher.StartNew(), the new jobs inherit the trace.
Example
public class ProcessOrderHandler : IJobHandler<ProcessOrderRequest>
{
    private readonly IBatchPublisher _batchPublisher;

    public async Task HandleAsync(ProcessOrderRequest message, CancellationToken ct)
    {
        // These jobs automatically inherit the trace from ProcessOrderRequest
        var shipItems = items.Select(i => new ShipItemRequest { ItemId = i.Id }).ToList();
        var batchId = await _batchPublisher.StartNew(shipItems);

        // Continuation also inherits the trace
        await _batchPublisher.ContinueBatchWith(
            new List<SendInvoiceRequest> { new() { OrderId = message.OrderId } },
            batchId);
    }
}
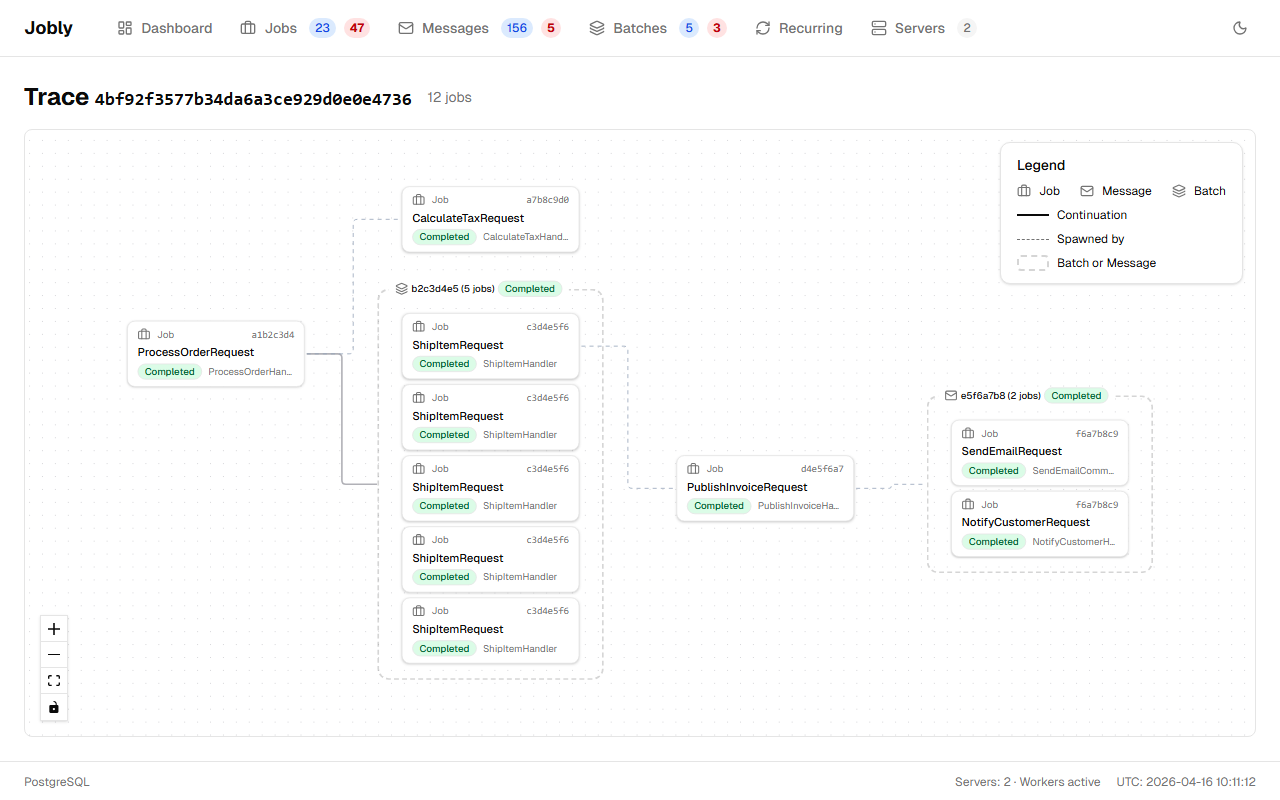
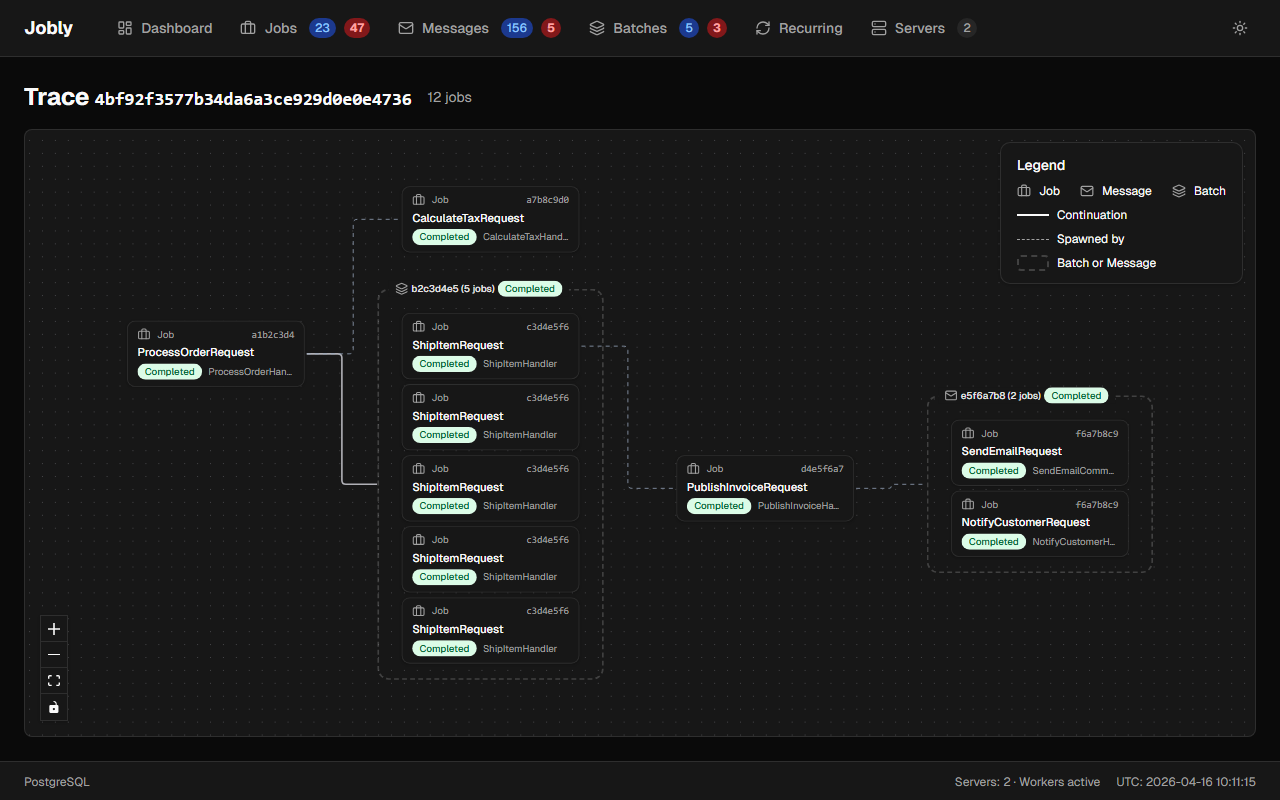
The dashboard shows the full trace:
The "Trace (9 jobs)" card shows all jobs spawned from this ProcessOrderRequest: 6 ShipItemRequests and 2 PublishInvoiceRequests. Clicking any job navigates to its detail, which shows the same trace from that job's perspective.
Clicking the trace link opens a dedicated visualization page showing the full DAG:
Message-Routed Jobs
When a message is routed to multiple handlers, all resulting jobs share a TraceId:
await publisher.Publish(new OrderNotification()); // Routes to EmailHandler + SlackHandler
// Both jobs get the same TraceId
OpenTelemetry Integration
Jobly produces OTel-standard distributed traces and metrics using System.Diagnostics. Everything is on by default with zero configuration.
Distributed Tracing
Every job execution creates a System.Diagnostics.Activity with:
- TraceId — matches the job's database
TraceId - SpanId — unique per execution (new SpanId on retries)
- ParentSpanId — the SpanId of whoever enqueued this job (HTTP request, another handler, etc.)
This creates a proper trace tree across job chains:
HTTP Request (TraceId: T, SpanId: A)
  └── Enqueue(ProcessOrder)      → Activity(TraceId: T, SpanId: B, ParentId: A)
       └── Enqueue(ShipItem)     → Activity(TraceId: T, SpanId: C, ParentId: B)
            └── Enqueue(Notify)  → Activity(TraceId: T, SpanId: D, ParentId: C)
Trace context is automatically propagated:
- When a handler calls
publisher.Enqueue(), the child job captures the handler's SpanId - When a message is routed to multiple handlers, all child jobs inherit the publisher's span
- Batch children inherit the same parent span
Log Correlation
AddJoblyWorker automatically configures ActivityTrackingOptions so TraceId, SpanId, and ParentId appear in your log output:
info: MyApp.Handlers.SendReport[0]
      => SpanId:b7ad6b7169203331, TraceId:550e8400e29b41d4a716446655440000, ParentId:a1b2c3d4e5f60718
      Sending report to user 42
No configuration needed — this works with the built-in console logger and any provider that supports scopes.
Span Attributes
Each job execution span includes these tags:
| Attribute | Example | Description |
|---|---|---|
messaging.system | "jobly" | OTel semantic convention |
messaging.operation.name | "process" | OTel semantic convention |
messaging.destination.name | "default" | Queue the job belongs to |
messaging.message.id | "550e8400-..." | Job ID |
jobly.job.type | "MyApp.SendReport" | .NET type name |
jobly.job.kind | "Job" | Job, Message, or Batch |
jobly.job.status | "succeeded" | Set after execution: succeeded, failed, retried, cancelled |
jobly.job.duration_ms | 142.5 | Handler execution time (on success) |
jobly.job.retry_count | 2 | Current retry count (only if retried) |
On failure, Activity.SetStatus(Error) is called with the exception message.
Span Events
Key lifecycle moments are recorded as events on the span:
| Event | When | Attributes |
|---|---|---|
jobly.job.completed | Handler succeeds | duration_ms |
jobly.job.failed | Handler throws (no retries left) | exception.type, exception.message |
jobly.job.retried | Handler throws (will retry) | retry_count, max_retries |
jobly.job.cancelled | Job cancelled while running | — |
Metrics
Jobly exposes four metrics through a System.Diagnostics.Metrics.Meter named "Jobly":
| Metric | Type | Unit | Tags | Description |
|---|---|---|---|---|
jobly.job.duration | Histogram | ms | queue, type, status | Handler execution time |
jobly.job.active | UpDownCounter | {job} | queue | Currently processing jobs |
jobly.job.completed | Counter | {job} | queue, type, status | Jobs that finished processing |
jobly.job.enqueued | Counter | {job} | queue, kind | Jobs enqueued |
The status tag is one of: succeeded, failed, retried, cancelled.
The kind tag is one of: job, message, batch.
Exporting to OTel Backends
To export traces and metrics to Jaeger, Prometheus, Datadog, etc., subscribe to the "Jobly" source and meter:
builder.Services.AddOpenTelemetry()
    .WithTracing(t => t.AddSource("Jobly"))
    .WithMetrics(m => m.AddMeter("Jobly"));
Without this, traces still appear in logs (via ActivityTrackingOptions) and metric calls are silent no-ops — no overhead.