Counters
Raw view of every counter row in the database. Used for forensics ("what events happened, by metric, when") and addon visibility — any counter an addon writes to the Counter / Statistic tables shows up here automatically, no per-key wiring required.
Built-in counters
The worker writes the following keys on every job outcome:
| Key | Incremented when |
|---|---|
stats:succeeded | A job's handler completes successfully |
stats:failed | A job's handler throws and retries are exhausted |
stats:deleted | A job ends in the Deleted state (user cancellation, mutex Skip, stale recovery, etc.) |
stats:requeued | A job is put back on the queue without finishing — covers Retry backoff and Mutex Wait |
Each event also writes a parallel :{yyyy-MM-dd-HH} hourly key so the chart can break the same metric down by hour.
The page
Two sections, polled every 5s:
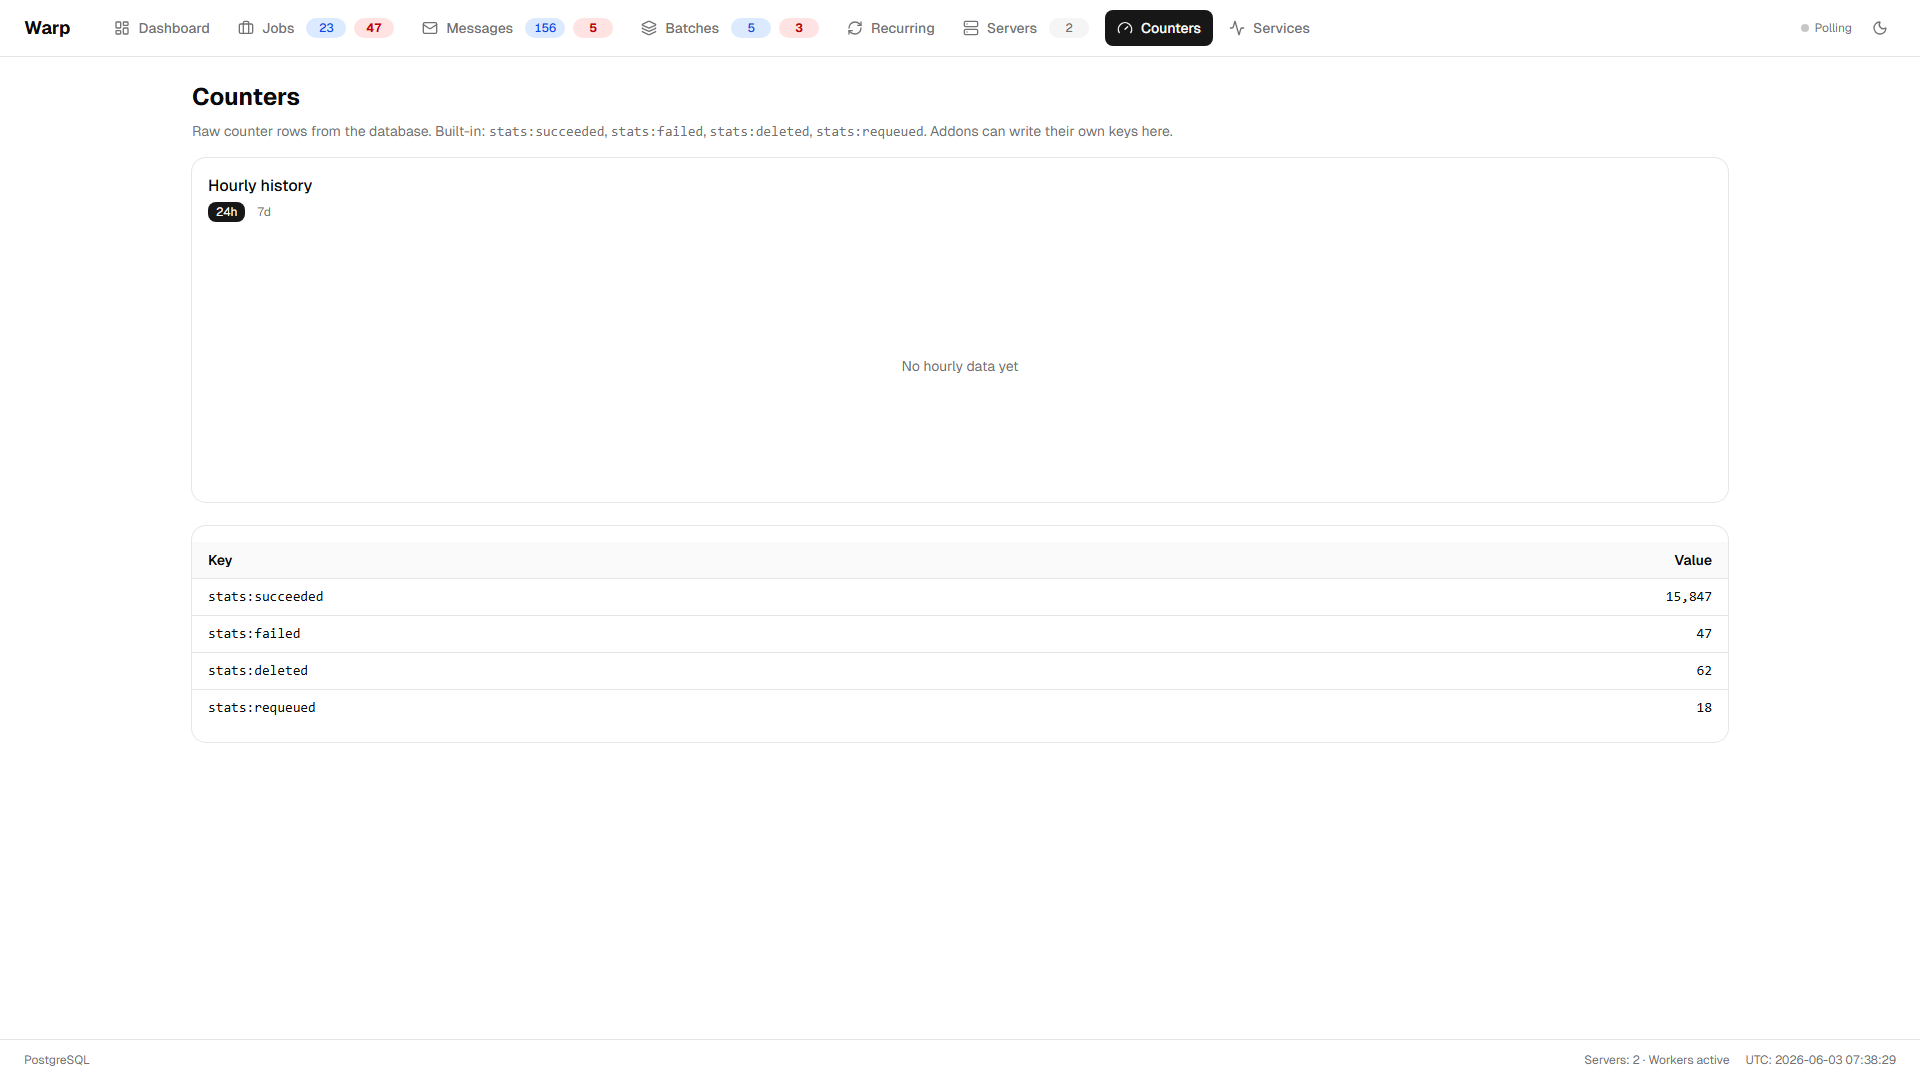
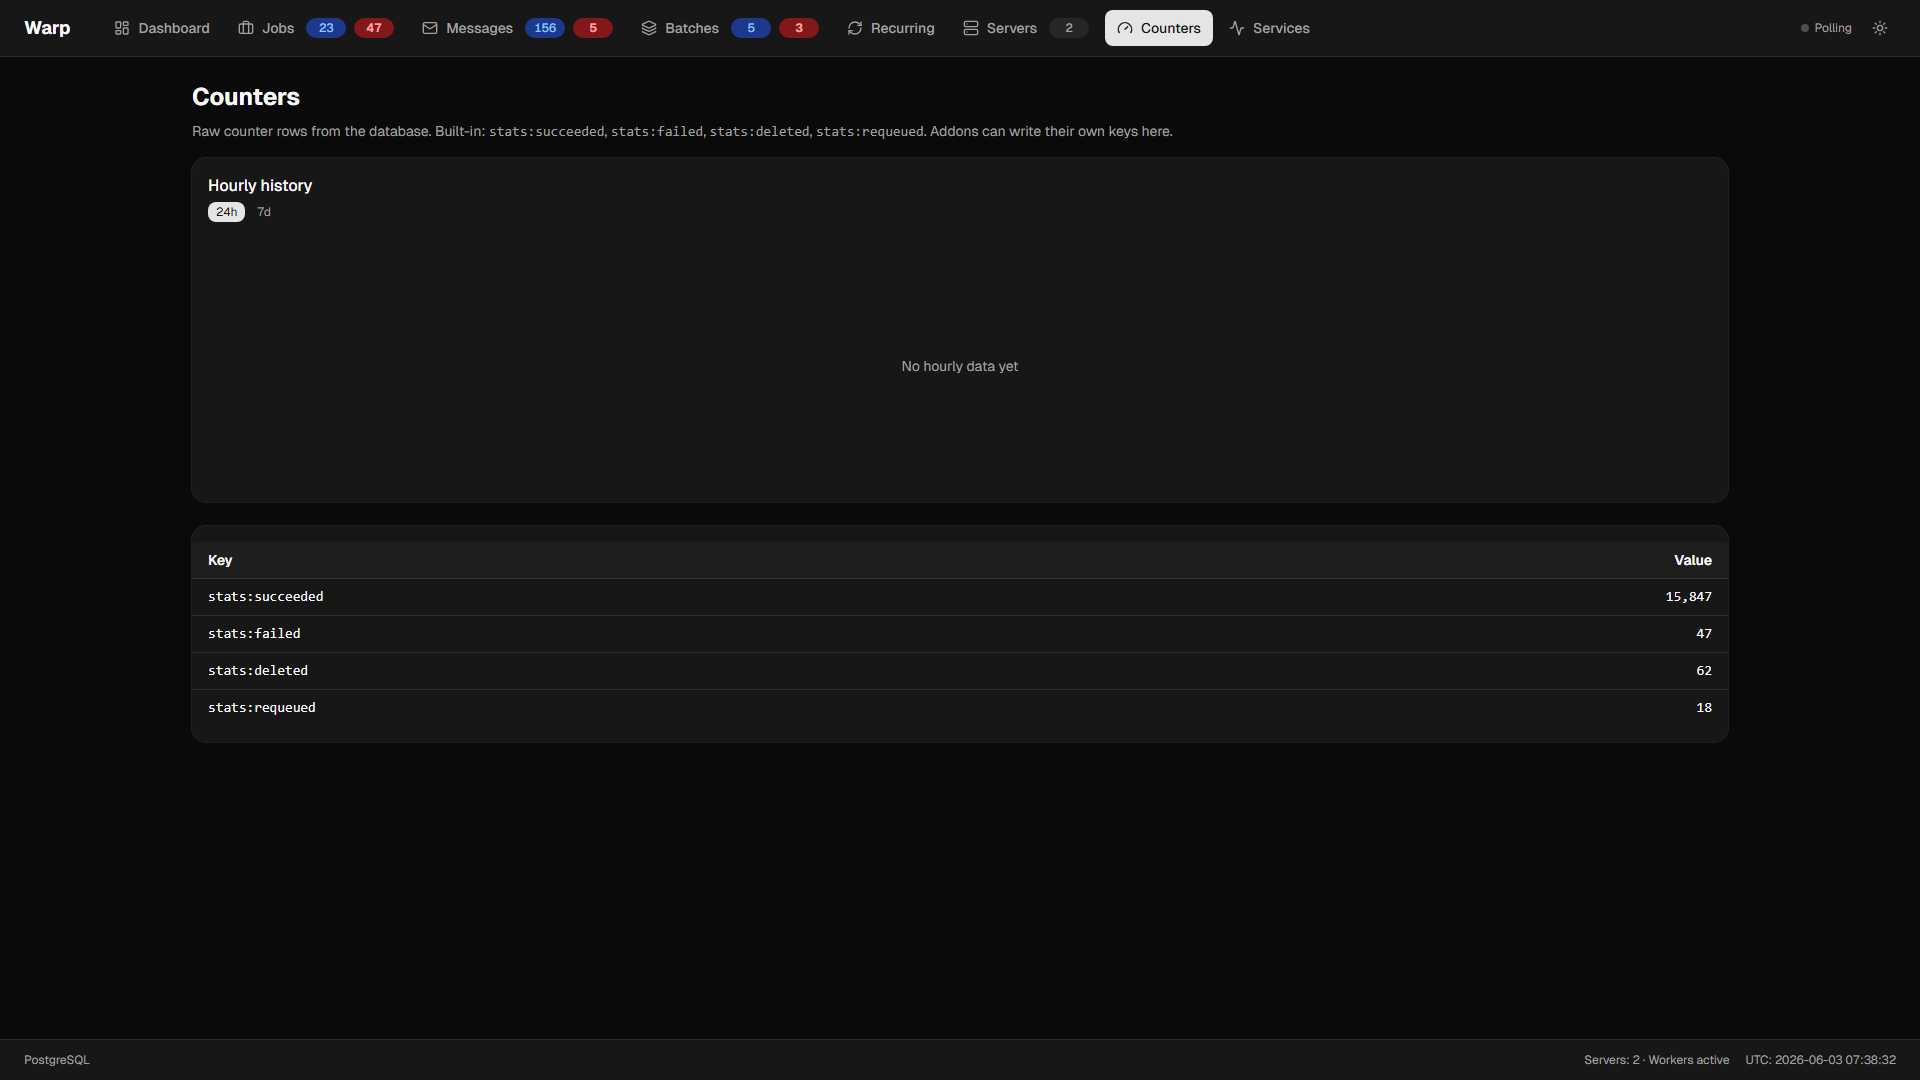
Hourly history chart — every hourly counter is its own series. Toggle 24h / 7d. Click a legend entry to hide that series. Built-in metrics get fixed colors (succeeded green, failed red, deleted gray, requeued amber); addon-defined keys get a deterministic color hashed from the key name so it stays the same across reloads.
Counters table — the rolled-up totals (lifetime values), one row per key, sorted alphabetically. Hourly variants are filtered out of this view; the chart consumes them separately.
Counters vs. Dashboard
These pages answer different questions:
- Dashboard — what is the system doing right now. Live state counts (Enqueued / Processing / Failed waiting in queue / etc.), realtime per-second delta chart, headline succeeded/failed history. Built around current health.
- Counters — what events have happened over time. Lifetime totals for every metric and historical breakdown of every hourly counter. Built around forensics and addon visibility.
The only data overlap is the headline succeeded / failed series appearing on both. The dashboard shows them as the operationally relevant rate; the counters page shows them as two of N series alongside everything else.
Storage and retention
Two tables back the counters:
Counter— write-optimized, append-only. Every event becomes a new row. Workers and command handlers write here on the hot path with no row-level contention.Statistic— read-optimized, one row per key. TheAggregateCountersbackground task (see Servers — Background Tasks) periodically readsCounterrows, sums by key, applies the sum to the matchingStatisticrow, and deletes the consumedCounterrows.
Reads merge both tables (Statistic.Value + sum(Counter.Value)) so a counter row written milliseconds before the page loads still surfaces — no aggregation lag visible to the operator.
Retention:
- Rolled-up keys (e.g.
stats:succeeded) are kept forever. They're lifetime totals. - Hourly keys (
stats:succeeded:2026-05-07-10) are pruned after 7 days byExpirationCleanup. Both built-in and addon-defined hourly metrics are pruned with the same retention as long as the key follows the<base>:yyyy-MM-dd-HHconvention.
Custom counters from addons
Anything you write to the Counter table appears here. To add an addon-specific metric:
context.Set<Counter>().Add(new Counter { Key = "addon:my-metric", Value = 1 });

// Optional — write a parallel hourly key if you want it on the chart.
var hourSuffix = DateTime.UtcNow.ToString("yyyy-MM-dd-HH");
context.Set<Counter>().Add(new Counter { Key = $"addon:my-metric:{hourSuffix}", Value = 1 });
The aggregator and cleanup handle the rest — addon:my-metric shows up in the table immediately, the hourly variant gets graphed and pruned at 7 days. Use +1 / −1 deltas (the column is signed) and let the aggregator sum them.