

Control Tower
The Control Tower is Beacon’s operations view. It shows the health of every subscription you can read over a time window: success rate, runs and failures, open tasks and anomaly activity, so you can spot failing or silent monitors early.
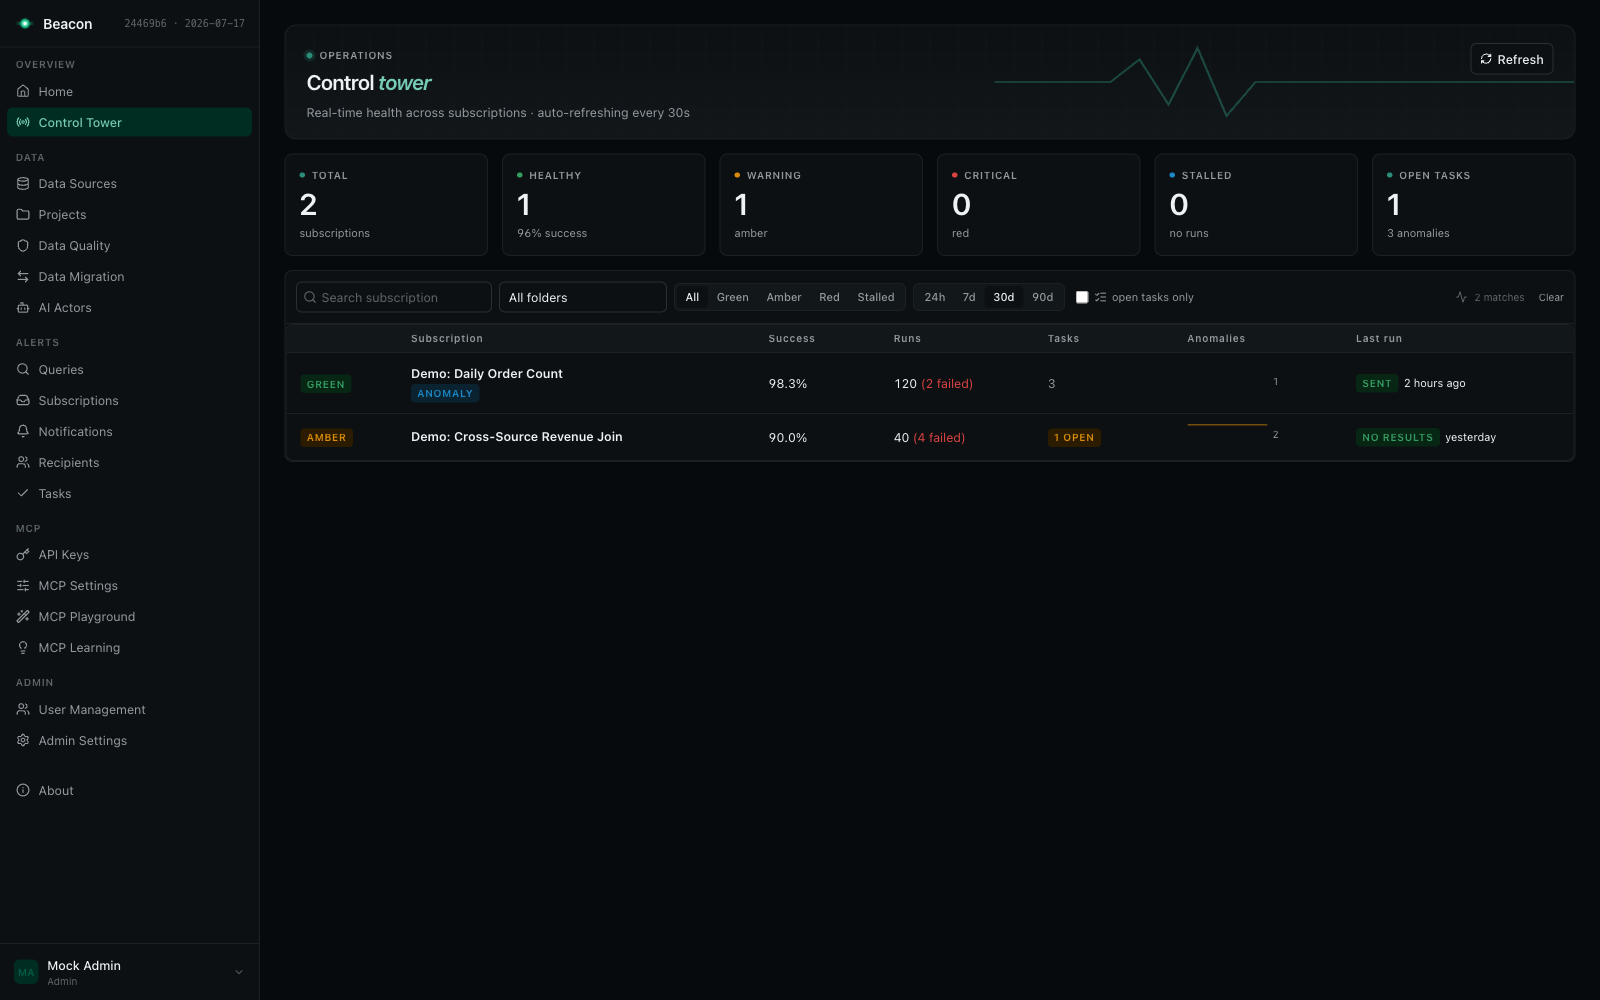
Open it from Control Tower in the navigation (/beacon/control-tower).
What you see
Section titled “What you see”The page answers three questions per subscription:
- Is it working? Success rate, run and failure counts, and a health status (Green, Amber, Red, Stalled).
- Does it need attention? The number of open (unresolved) tasks.
- Is the data behaving? Anomaly counts and a per-day sparkline from anomaly detection.
Everything on the page (the KPI cards, the rows and the detail panel) covers only subscriptions in projects you can read. A project-restricted API key or MCP caller sees only the runs its projects may read.
Health statuses
Section titled “Health statuses”Each subscription gets one status, computed from its runs within the selected time window (default 30 days).
| Status | Rule |
|---|---|
| Green | Success rate of at least 90% |
| Amber | Success rate of at least 70% and below 90% |
| Red | Success rate below 70% |
| Stalled | No runs in the window, and the subscription was created more than 1 day ago |
- New subscriptions stay Green. A subscription with no runs that was created within the last day counts as Green (waiting for its first run), not Stalled.
- Stalled ignores the past. A subscription that ran well last quarter but has no runs in the selected window is Stalled. Silence is a failure mode.
What counts as a successful run
Section titled “What counts as a successful run”The success rate is successful runs / total runs × 100. A run is successful when its notification status is one of:
NotificationSent: the query ran and a notification went out;NoResults: the query ran and returned nothing to alert on;NotificationSilenced: the query ran and the notification was silenced (for example, no anomaly was detected).
Every other outcome (Failed, Timeout, Created, BelowThreshold, Skipped) counts against the subscription. The
failed count shown is total − successful.
A Skipped run is a scheduled run that did not execute: either the subscription’s owner (the user its scheduled runs run
as) may no longer run its query, or the query’s change is not approved. Skipped runs count as unsuccessful, so a
subscription whose runs keep being skipped turns Amber and then Red.
KPI cards
Section titled “KPI cards”Six cards sit at the top, scoped to the current filters and time window:
| Card | Value |
|---|---|
| Total | Subscriptions matching the filters |
| Healthy | Green subscriptions; the subtitle is the overall success rate (all successes ÷ all runs) |
| Warning | Amber subscriptions |
| Critical | Red subscriptions |
| Stalled | Subscriptions with no runs in the window (created more than a day ago) |
| Open tasks | Unresolved tasks across matching subscriptions; the subtitle is the anomaly count in the window |
When data contracts you can read are not evaluated because their owner may no longer run them, a warning under the cards gives the count and links to Data Quality.
Statistics are cached on the server for 30 seconds per filter combination. With no runs at all, the overall success rate is 100%.
The health table
Section titled “The health table”Each matching subscription is a row:
| Column | Content |
|---|---|
| (status) | Green, Amber, Red or Stalled pill |
| Subscription | Query name and folder path, with badges: AI · {actor} when an AI actor is assigned, Anomaly when anomaly detection is on, Owner not authorized when the owner may no longer run the query, and Not approved when the last run was skipped because the query’s change is not approved |
| Success | Success rate in the window (n/a when there are no runs) |
| Runs | Total runs, with the failed count highlighted when above zero |
| Tasks | Open task count as a warning pill, or the total task count when nothing is open |
| Anomalies | Sparkline of anomaly events per day across the window, with the total |
| Last run | Outcome pill (Sent, Failed, Timeout, No results, Silenced, Skipped, …) and the time of the most recent run |
The table shows 20 rows per page. Filters, sort and page are kept in the URL.
Sorting
Section titled “Sorting”Without a sort the table is worst first: most open tasks first, then lowest success rate. Click a column header to sort by Subscription (query name), Success, Runs or Tasks instead.
Row detail
Section titled “Row detail”Click a row to open its detail panel:
- the query name and the cron schedule, with Open subscription and, when tasks are open, a link to them;
- a Not approved notice when the last run was skipped because the query’s change is not approved (save the query to submit its SQL for approval, or restore a version and approve it; see Approvals);
- an Owner not authorized notice when scheduled runs are skipped because of the owner; an Admin or a UserAdmin assigns another owner on the subscription page (see Subscriptions);
- recent executions: the last 20 runs with outcome, time, row count, execution time and, for failed runs, the recorded failure reason (other stored text shows as a generic reason);
- open tasks: up to 20 unresolved tasks with priority, assignee and snooze state;
- recent anomalies: up to 20 anomaly events in the window with severity, detected value, explanation and acknowledged state.
Filters
Section titled “Filters”All filters combine and apply to both the KPI cards and the table:
| Filter | Options | What it does |
|---|---|---|
| Search | Free text (applied on Enter or when the field loses focus) | Matches the query name |
| Folder | Any query folder | Only subscriptions whose query is in that folder |
| Health | All, Green, Amber, Red, Stalled | Only subscriptions in that status |
| Time range | 24h, 7d, 30d, 90d | The window for every count, rate, status and sparkline (default 30d) |
| open tasks only | Checkbox | Only subscriptions with at least one unresolved task |
Changing a filter returns to the first page. Clear resets the filters.
Refresh
Section titled “Refresh”- The page refetches every 30 seconds and when the browser tab regains focus.
- Refresh reloads at once.
- If a selected subscription drops out of the refreshed result (for example, it no longer matches the filters), its detail panel closes.
REST API
Section titled “REST API”Three read-only routes under /beacon/api/control-tower:
| Route | What it returns |
|---|---|
GET /statistics | KPI counts for the filters, as { "statistics": { … } } |
GET /health | A page of per-subscription health rows |
GET /subscriptions/{id}/detail | Recent runs, open tasks and anomalies of one subscription (timeRangeDays, default 30) |
/statistics and /health take the same filters:
| Parameter | Type | Default | What it does |
|---|---|---|---|
timeRangeDays | integer | 30 | Size of the window in days |
folderId | integer | One query folder | |
dataSourceId | integer | One data source | |
healthStatus | enum | Green, Amber, Red or Stalled | |
hasUnresolvedTasks | boolean | true for subscriptions with open tasks only | |
searchKeyword | string | Substring of the query name |
/health is a paged list and also takes:
| Parameter | Default | What it does |
|---|---|---|
page | 0 | Zero-based page number |
pageSize | 20 | Rows per page; values above 200 are lowered to 200 |
sort | worst first | Comma-separated columns, - prefix for descending: queryName, successRate, totalExecutions, unresolvedTaskCount |
Example:
curl "https://your-beacon-host/beacon/api/control-tower/health?timeRangeDays=7&healthStatus=Red&sort=-totalExecutions" \ --cookie "Beacon.Auth=..."curl "https://your-beacon-host/beacon/api/control-tower/statistics?timeRangeDays=7" \ --cookie "Beacon.Auth=..."The statistics object has totalSubscriptions, healthySubscriptions, warningSubscriptions, criticalSubscriptions,
stalledSubscriptions, totalUnresolvedTasks, totalAnomalies30Days (the anomaly count in the requested window),
overallSuccessRate, timeRangeDays and ownerNotAuthorizedContracts.
Suggested workflow
Section titled “Suggested workflow”- Keep the default sort. Worst first puts subscriptions with open tasks and low success rates on top.
- Triage Red and Stalled first. Red means runs fail; Stalled means nothing runs. Open the row and read the failure reason in the recent executions. Owner not authorized needs a new owner; Not approved needs the query change approved.
- Use open tasks only for follow-up. After an incident, filter to subscriptions with open tasks and work the list down.
- Watch the sparklines. A rising anomaly sparkline on a Green subscription means the runs succeed but the data is drifting.
- Widen the window for reviews. Use 90d in a periodic review to catch slow degradation.
Related
Section titled “Related”- Subscriptions: the scheduled runs the Control Tower monitors
- Tasks: the open tasks in the table and detail panel
- Anomaly Detection: the source of anomaly counts and sparklines
- Notifications: the delivery outcomes behind the success rate